
Fig. 3.
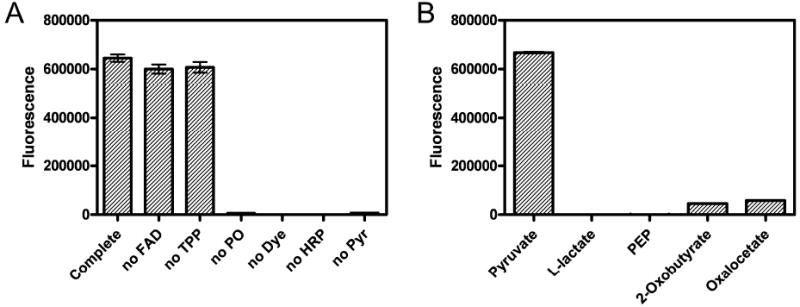
The specificity of the pyruvate assay is illustrated. A. Dropout experiments are shown (pyruvate 2 nmol/well except the no pyruvate experiments). B. Interference experiment are shown (compound content: 2 nmol/well). Data are the mean ± SD of triplicate wells. Error bars are not shown when their sizes are less than those of the symbols.