
Figure 4. Cell buckling under its own pushing force.
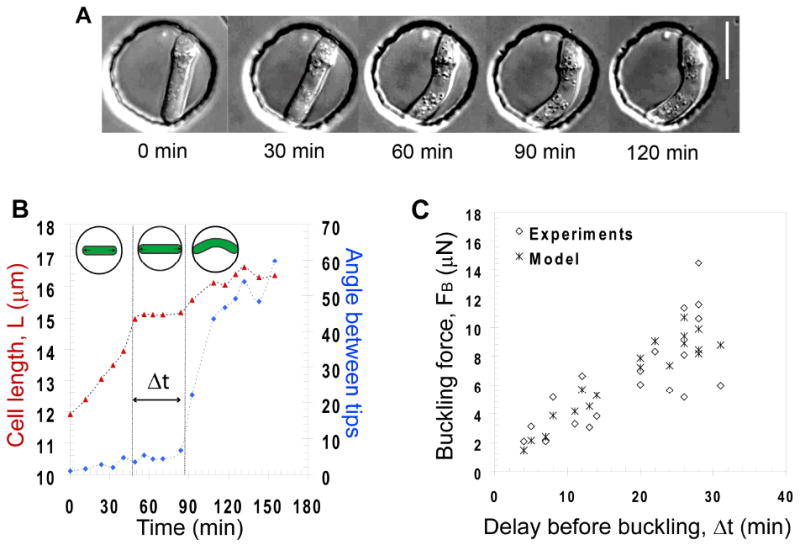
A) Time-lapse sequence of a fission yeast cell growing and buckling under its own pushing force in a rigid chamber. Bar=10μm. B) Example of a growth curve of a cell buckling in a 15μm chamber. The delay, Δt during which the cell length stalls is indicated. The angle between cell tips represented on the left axis in blue is used to detect the onset of buckling. C) Buckling force, FB plotted as a function of the delay, Δt, along with values predicted from the model. The yeast strains are NM11 and FC1234.