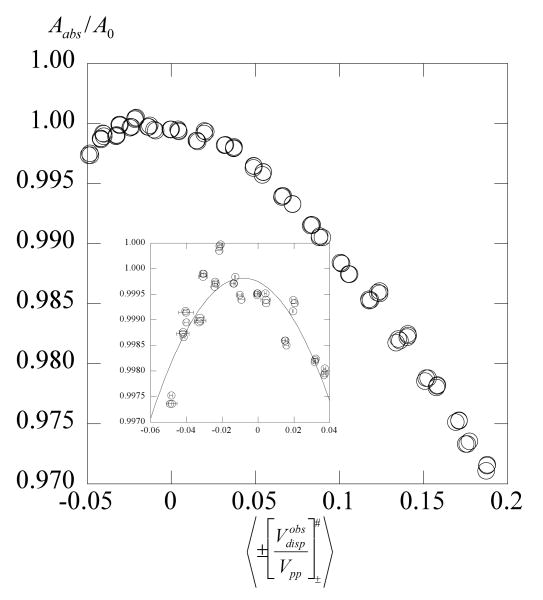
Figure 12.
Line shifts versus the observed dispersion for 46.7 mM PDT in 70% glycerol 273 – 352 K. The abscissa is the mean of values measured from MI = ± 1 corrected for instrumental dispersion; the error bars shown in the inset are the standard deviations. The solid line in the inset is a linear least-squares fit of the data to a quadratic. Spin exchange increases toward the right and dipolar toward the left. The lines shift toward one another both above and below the position of no shift near dispersion equal to zero. Negative values of the dispersion and line shifts toward the center of the spectrum at low temperatures are predictions of the theory in ref 20.

