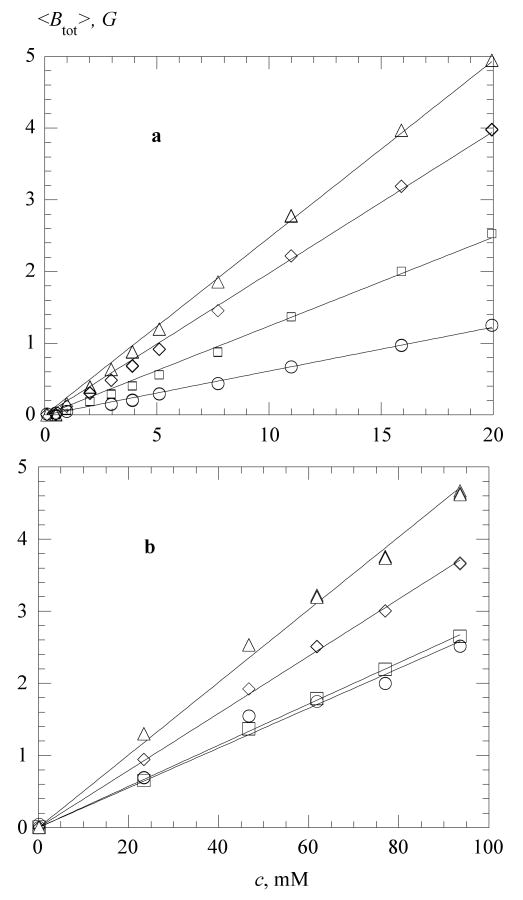
Figure 4.
Total linewidth versus PDT concentration (a) in water, at 268 K, ○; 298 K, □; 323K, ◊; and 338 K, △; and (b) in 70% glycerol, at 273 K, ○; 298 K, □; 323K, ◊; and 338 K, △. The straight lines are linear least-square fits constrained to the origin. The slopes are plotted in Figure 5. Coefficients of correlation, r, are larger than 0.999 at all temperatures in water. In 70 % glycerol, r = 0.986 (273 K), r >0.999 (298 and 323 K), and r = 0.986 (338 K).

