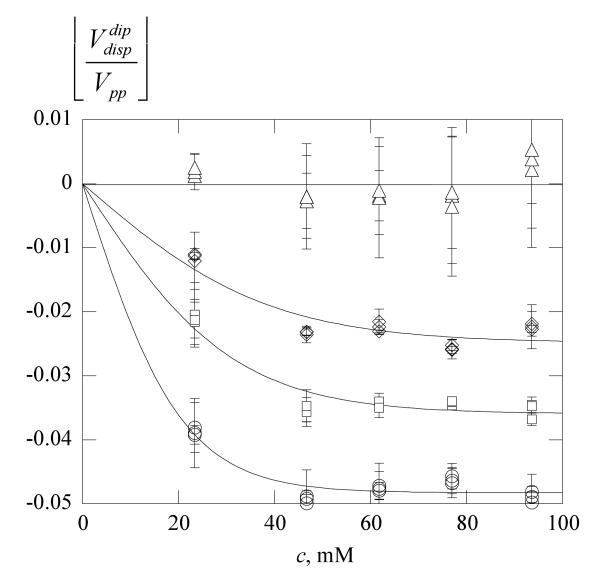
Figure 7.
Dipole-induced dispersion in 70% glycerol versus concentration. Same symbols as Figure 6b. The average value from eq 20 is plotted; the error bars are one-half the difference. The solid lines are least-squares fits to eq 8 with c* = 0, 21, 31, and 39 mM from high to low temperature, respectively. The plateau values and −0.048, respectively.

