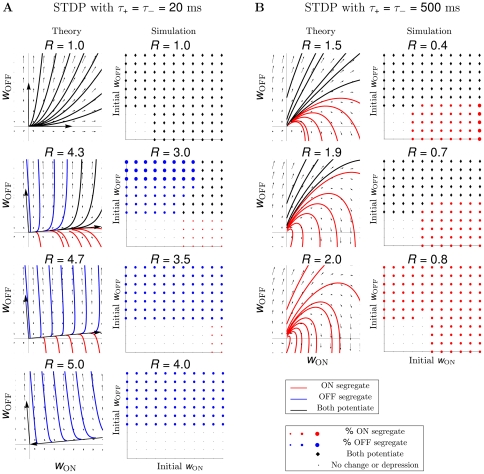
Figure 3. STDP without normalization does not result in segregation.
(A) STDP with spike integration time windows of 20 ms results in ON/OFF segregation only for two data sets out of six (data set 1 shown here; data set 2 not shown), assuming a depression-to-potentiation ratio,  , much larger than experimentally-observed. Theory and simulation show similar trends, although actual values of
  differ. (Theory) Vector fields and example trajectories of the ON-OFF weight dynamics illustrate results from the linear model. The direction of two eigenvectors of the plasticity matrix
  (pointing out of the origin for a positive eigenvalue, and into the origin for a negative eigenvalue) determine how
  affects segregation: as
  increases, regions of initial conditions where both weights potentiate (trajectories in black) become areas where segregation occurs (trajectories in red for ON and blue for OFF). (Simulation) In the simulated integrate-and-fire model (here, data set 1 with 3 ON and 3 OFF inputs), a separate simulation was run for each initial condition uniformly sampled between 0 and the maximum weight value,
  , for the ON and the OFF weights. Here
  and the discrete steps for the initial weights were
  . The colored symbol indicates the segregation outcome according to the legend, matching the color of the trajectories in the linear model. The size of the colored circles denotes the percentage of synaptic weights of a particular RGC type which potentiated maximally out of all RGCs of the same type initially wired to the LGN neuron (the three dots denote
  ,
,  and
and  , respectively), while all weights of the other RGC type depressed to 0. Initial weights too small to generate postsynaptic activity result in no synaptic change (dots in the bottom left region of each plot). (B) Extending the spike integration window to match the timescale of the input correlations to
  ms, results in pure dominance of the ON cells, both under the theoretical and the simulated model and for any value of the ratio
  (data set 1 shown here, but all others show the same behavior).

