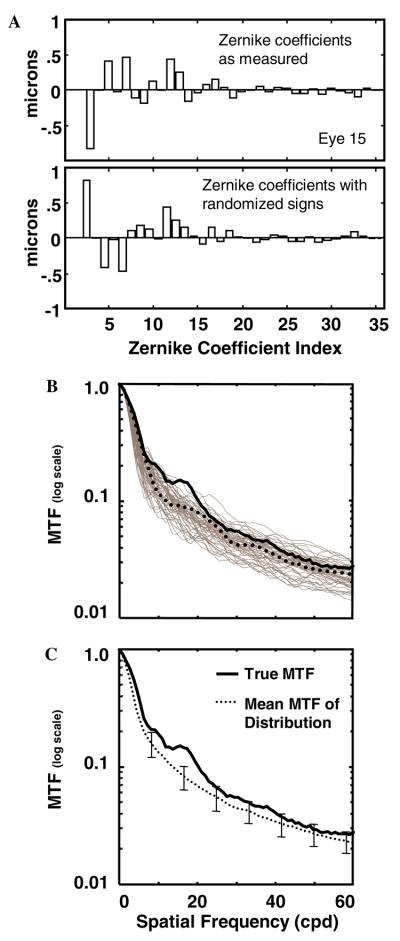
Fig. 2.
Results for one example subject. (A) Measured aberrations (top panel) and one example of randomized aberrations (bottom). (B) The distribution of MTFs resulting from aberration randomization. The thick solid curve is the MTF for the measured aberrations; the dotted curve is the MTF for the randomized aberrations shown above. The gray curves are the rest of the MTFs from the distribution. (C) Comparison of the true MTF to the mean MTF of the distribution. Error bars represent standard deviations.

