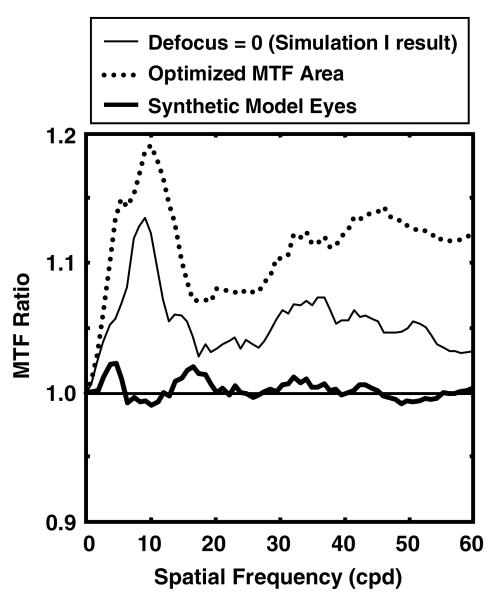
Fig. 5.
The thin solid curve is the MTF ratio for 6 mm pupils as in Fig. 4A with second-order defocus arbitrarily set to 0. The dotted curve is the MTF ratio that results from independently adjusting the defocus for the measured aberrations and for each randomization to optimize MTF area from 0 to 60 cpd. The thick solid curve is the MTF ratio for a set of 100 “synthetic” model eyes produced by randomly selecting and combining aberration terms from the population data of 44 eyes.

