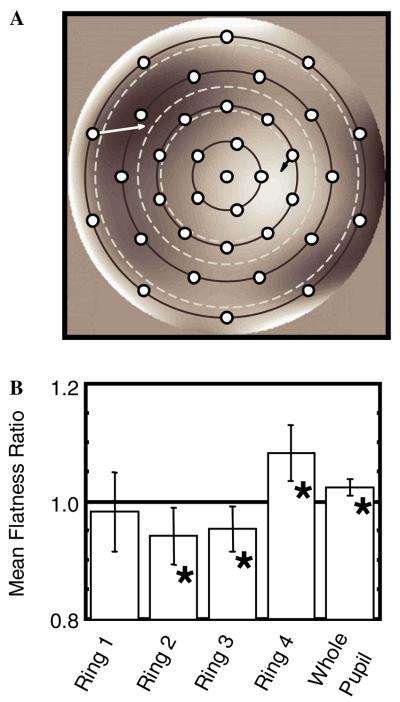
Fig. 7.
(A) Locations of the 36 2nd derivative samples. The white and black arrows indicate areas of rapid and slow change, respectively. The dark circles indicate rings 1–4 from the center outward. Ring 1 includes the pupil center. The white dashed circles indicate 3, 4, and 6 mm pupil diameters. (B) Wavefront Flatness Ratios across the pupil. True aberrations produce a flatter wavefront near the pupil center, and less flat wavefront closer to the pupil edge compared to the randomized wavefronts. Ring 1: μ = 0.98, t = 0.53, p = 0.60. Ring 2: μ = 0.94, t = 2.39, p = 0.02. Ring 3: μ = 0.95, t = 2.41, p = 0.02. Ring4: μ = 1.08, t = 3.38, p = 0.001. Total pupil: μ = 1.02, t = 3.13, p = 0.003. Asterisks indicate ratios that are significantly different from 1.0.

