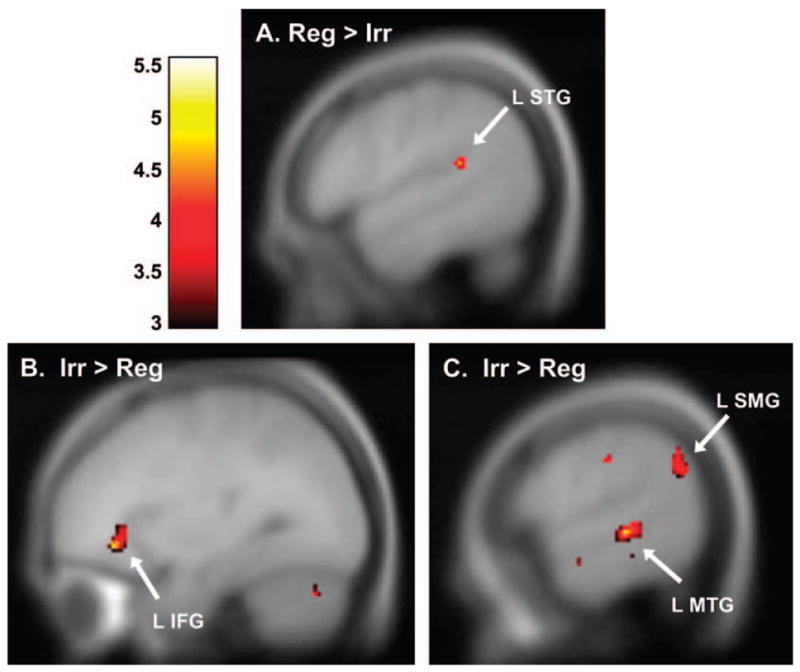
Fig. 2.

Brain images. Activations are shown on sagittal slices of a canonical composite brain. All activations were significant at p < 0.001 and k > 5, and are given in MNI coordinates (see Table 3). Color scale represents t values. (A) Participants showed greater activation in left STG for regular > irregular words (BA 22, x = −54, y = −40, z = 16, t = 5.06). (B) Participants showed greater activation in left IFG for irregular > regular (BA 45, x = −28, y = 28, z = 0, t = 4.44). (C) Participants also showed greater activation for irregular > regular in both left MTG (BA 3, x = −44, y = 0, z = 46, t = 6.27) and SMG (BA 40, x = −58, y = −58, z = 32, t =4.18). MNI, Montreal Neurological Institute; STG, superior temporal gyrus; IFG, inferior frontal gyrus; MTG, middle temporal gyrus; SMG, supramarginal gyrus. BA, Brodmann area.
