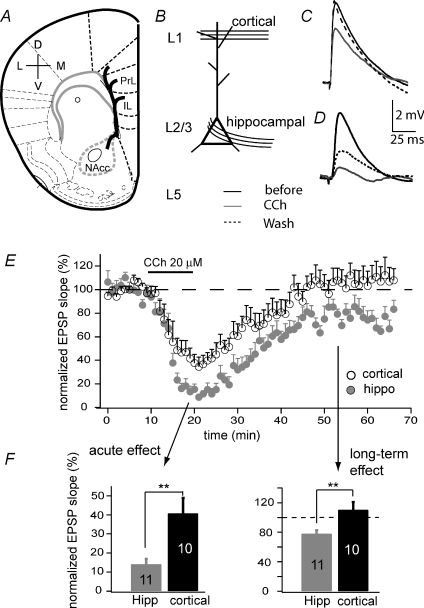
Figure 1. Acute and long-term suppression of EPSPs in the mPFC.
A, schematic diagram showing a coronal slice preparation on which hippocampal projections to mPFC were preserved. The bold curvy line indicates the projection trajectory. PrL: prelimbic; IL: infralimbic region. B, recording configuration highlighting layer 2/3 (L2/3) pyramidal neurons that receive both cortical inputs at layer 1 (L1) and hippocampal afferents. Selective stimulation of these pathways resulted in input-specific EPSPs (C and D). C, representative cortical EPSPs before, during and 30 min after application of 20 μm carbachol (CCh). D, representative hippocampal EPSPs before, during and 30 min after application of 20 μm CCh. E, comparison of the time course of CCh-induced EPSP suppression at the cortical and hippocampal pathways. F, EPSP suppression at different phases (**P < 0.01).

