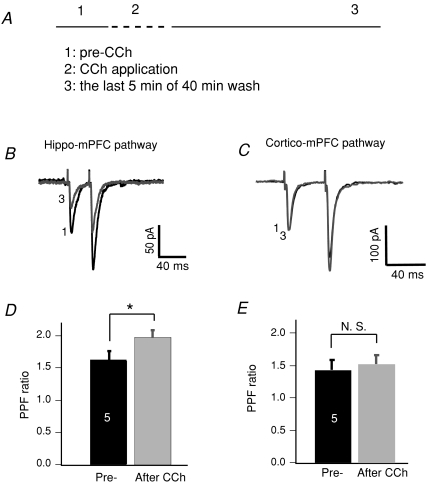
Figure 2. Changes in PPF ratio associated with the hippocampal pathway.
A, experimental procedure showing three phases: pre-CCh, CCh application and CCh washout. B, averaged EPSC traces in response to two consecutive stimulations of the hippocampal–mPFC pathway, taken from phases 1 and 3, were superimposed. Note that the first EPSC remained suppressed after CCh was washed out. C, traces of EPSCs in response to stimulation of cortical pathways. Note that the first EPSC was completely recovered from CCh-induced acute depression. D, comparison of the PPF ratio of hippocampal synapses before CCh application and after CCh washout (**P < 0.01). The PPF ratio was calculated as EPSC2/EPSC1. E, comparison of the PPF ratio of cortical/local circuitry synapses before CCh application and after CCh washout (N. S.: non-significant).

