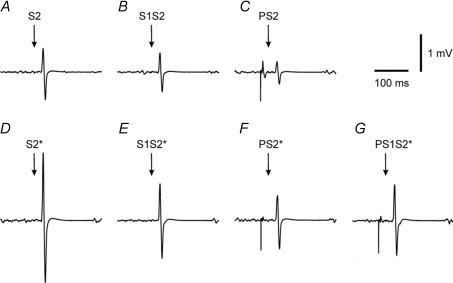
Figure 1. Interactions between SICI and SAI in one subject (Experiment 1).
All traces are averages of 10 trials of EMG recordings from the contracting right ADM of one representative subject. Conditions in A–G correspond to conditions A–G in Table 1. From these data the following MEP ratios were calculated: SICI alone (S1S2/S2 = 0.76; S1S2*/S2*= 0.57), SICI with co-applied P (PS1S2*/PS2*= 1.32), SAI alone (PS2/S2 = 0.43; PS2*/S2*= 0.41), and SAI with co-applied S1 (PS1S2*/S1S2*= 0.95). Note the match of MEP amplitude between S2 and PS2*.

