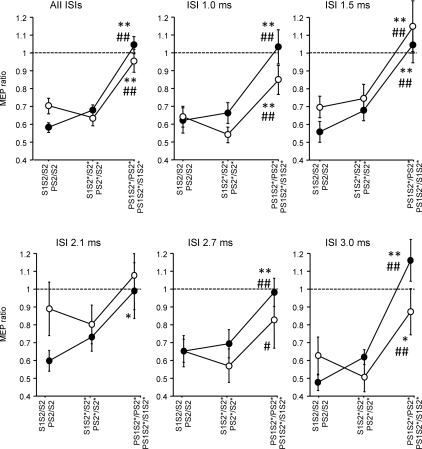
Figure 2. Interactions between SICI and SAI – effects of the interval between S1 and S2 (Experiment 1).
SICI alone (S1S2/S2, S1S2*/S2*) vs. SICI with co-applied P (PS1S2*/PS2*, open circles) and SAI alone (PS2/S2, PS2*/S2*) vs. SAI with co-applied S1 (PS1S2*/S1S2*, filled circles) are shown as grand average across all ISIs between S1 and S2, and separately for the single ISIs (1.0, 1.5, 2.1, 2.7 and 3.0 ms). Values less than 1 (dashed horizontal lines) indicate inhibition. S1 inhibited PS2* significantly less than S2 or S2* alone, irrespective of ISI. In some instances, PS1S2*/PS2* even resulted in values larger than 1, indicating disinhibition. Similarly, P inhibited S1S2* significantly less than S2 or S2* alone, irrespective of ISI. Again, in some instances PS1S2*/S1S2* resulted in values larger than 1, indicating disinhibition. Significant differences between PS1S2*/PS2* and S1S2/S2, or between PS1S2*/S1S2* and PS2/S2 are indicated by * (P < 0.05) or ** (P < 0.01). Significant differences between PS1S2*/PS2* and S1S2*/S2*, or between PS1S2*/S1S2* and PS2*/S2* are indicated by # (P < 0.05) or ## (P < 0.01). All data are means ± 1 s.e.m. of 10 subjects.

