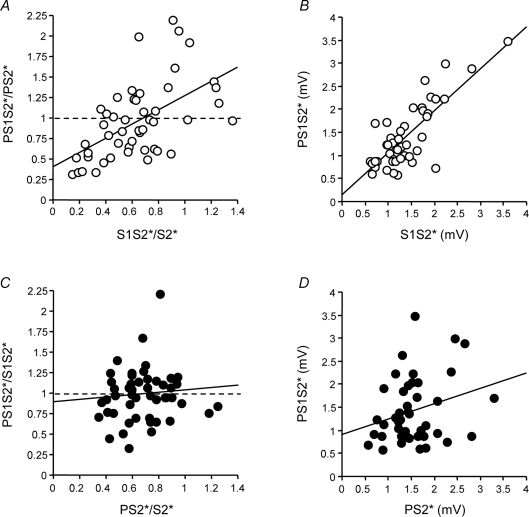
Figure 3. Correlations between SICI without vs. with co-applied P (A), between SAI without vs. with co-applied S1 (C), and between MEP amplitude of S1S2* (B) or PS2* (D) with MEP amplitude of PS1S2* (Experiment 1).
A, SICI alone (S1S2*/S2*) is plotted against SICI with co-applied P (PS1S2*/PS2*). Each data point is from one single subject (n= 10) and one ISI between S1 and S2 (5 different ISIs). Values less than 1 (dashed line) indicate inhibition. The thick continuous line is the regression line. B, MEP amplitude (in mV) of S1S2* is plotted against that of PS1S2*. C, SAI alone (PS2*/S2*) is plotted against SAI with co-applied S1 (PS1S2*/S1S2*). D, MEP amplitude (in mV) of PS2* is plotted against that of PS1S2*. Arrangement and conventions in B–D are otherwise the same as in A.

