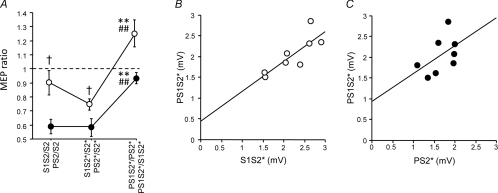
Figure 5. SICI without vs. with co-applied P, and SAI without vs. with co-applied S1 at a reduced S1 intensity of 70% AMT (Experiment 3).
A, SICI alone (S1S2/S2, S1S2*/S2*) vs. SICI with co-applied P (PS1S2*/PS2*, open circles) and SAI alone (PS2/S2, PS2*/S2*) vs. SAI with co-applied S1 (PS1S2*/S1S2*, filled circles) are shown. Values less than 1 (dashed horizontal line) indicate inhibition. S1 inhibited PS2* significantly less than S2 or S2* alone. Similarly, P inhibited S1S2* significantly less than S2 or S2* alone. Significant differences between PS1S2*/PS2* and S1S2/S2, and between PS1S2*/S1S2* and PS2/S2 are indicated by ** (P < 0.01). Significant differences between PS1S2*/PS2* and S1S2*/S2*, and between PS1S2*/S1S2* and PS2*/S2* are indicated by ## (P < 0.01). Significant differences between S1S2/S2 vs. PS2/S2, and between S1S2*/S2*vs. PS2*/S2* are indicated by † (P > 0.05). All data are means ± 1 s.e.m. of 8 subjects. B, MEP amplitude (in mV) of S1S2* is plotted against that of PS1S2* with the regression line indicated. C, MEP amplitude (in mV) of PS2* is plotted against that of PS1S2* with the regression line indicated.

