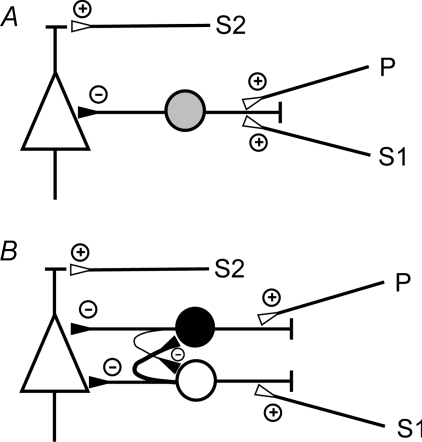
Figure 6. Simple connectivity models to explain the interactions between SICI and SAI.
A, the excitatory input pathways of SICI and SAI converge onto the same inhibitory interneuron (grey circle), which in turn synapses onto a corticospinal neuron (triangle). B, the excitatory input pathways of SICI and SAI synapse onto distinct subtypes of inhibitory interneurons (black and white circle), which in turn synapse onto a common corticospinal neuron (triangle) with the SICI input located closer to the axon initial segment than the SAI input. The interneurons mutually inhibit each other, with a stronger inhibition from the SICI interneuron onto the SAI interneuron (symbolized by a thicker axon) than the other way round. Small circles with a plus indicate excitatory synapses, while small circles with a minus indicate inhibitory synapses. In addition, both models contain an excitatory input to the corticospinal neuron, which when activated by S2 results in elicitation of a test MEP.

