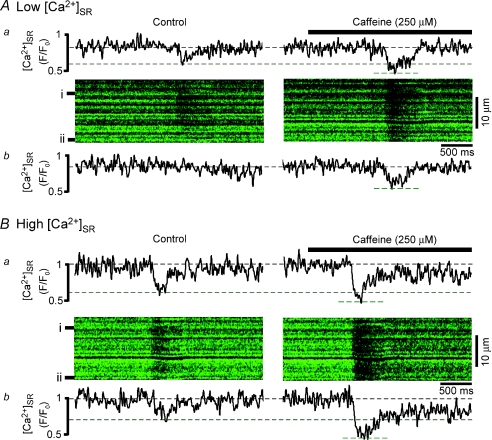
Figure 3. During excitation–contraction coupling caffeine increases release junction recruitment and decreases the [Ca2+]SR at which release terminates.
Confocal line scan images from the same cell of [Ca2+]SR depletions during excitation–contraction coupling at low (A) and high (B) initial [Ca2+]SR under control conditions (left) and after addition of 250 μm caffeine (right). F/F0 profiles of fluorescence from two individual SR release junctions (denoted by black bars to left of images) are shown above (a) and below (b) images. F0 corresponds to fluo-5N fluorescence at high load. Dashed lines denote [Ca2+]SR level prior to field stimulus and at lowest level during release. Note that at low initial SR Ca2+ load, not all release junctions release Ca2+ (e.g. junction ii in Ab). Caffeine lowered the [Ca2+]SR at release termination by 21 ± 2%; n= 15 events from 5 cells, P < 0.05.

