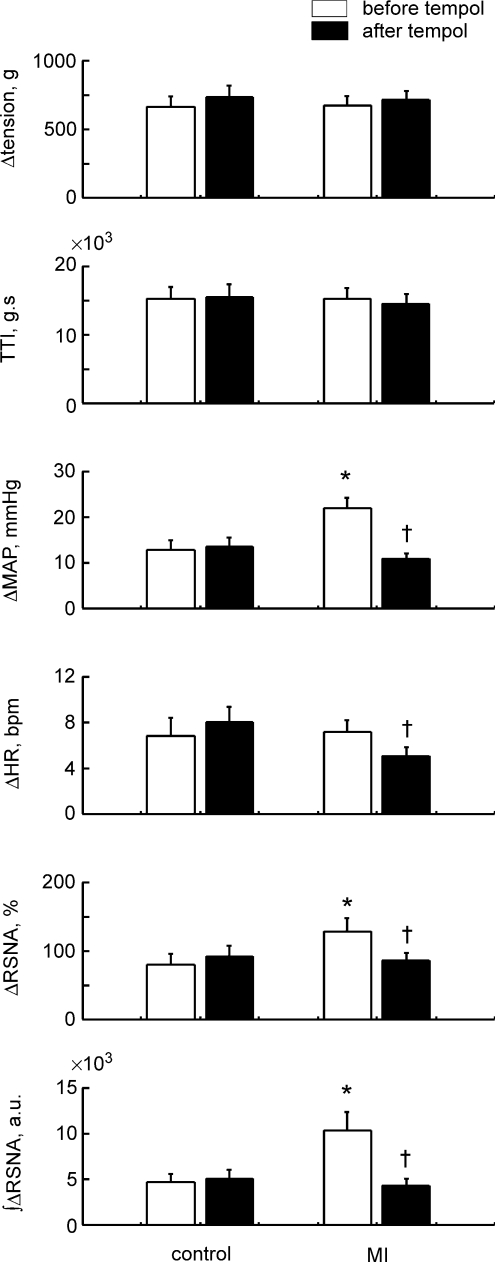
Figure 3.
Comparisons of Δtension, tension–time index (TTI), ΔMAP, ΔHR, ΔRSNA and the integrated ΔRSNA during 30 s continuous static contraction before and after injection of tempol in 14 healthy controls and 15 MI rats. Δvalues are the peak increases seen during 30 s contraction. TTI and the integrated ΔRSNA are the 30 s integrated values. Values are means ±s.e.m.*P < 0.05 vs. healthy controls. †P < 0.05 vs. before tempol injection. Significant differences were detected by Tukey's post hoc test following two-way repeated ANOVA.

