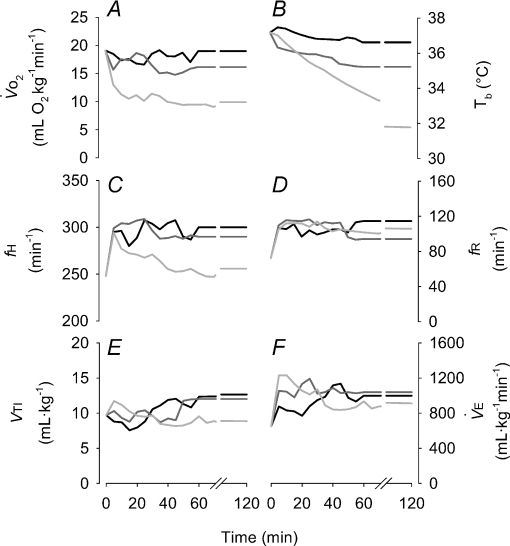
Figure 1. Time course (average values; error bars not shown for visual clarity) of the pertinent physiological factors under exposure to different levels of oxygen in the Columbian ground squirrel, demonstrating steady state values were achieved by the second hour of exposure.
Black lines indicate 12% O2, dark grey indicate 10% O2 and light grey indicate 7% O2. Shown are  (A), Tb (B), heart rate (C), breathing frequency (D), tidal volume (E) and minute ventilation (F).

