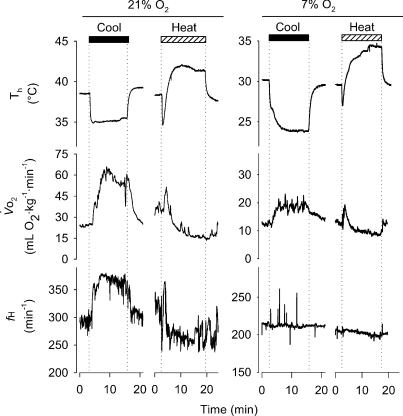
Figure 3. Sample traces of the influence of Th manipulation on metabolic heat production ( ) and heart rate (fH) under normoxia (left traces) and hypoxia (7% O2; right traces) in Columbian ground squirrels.
Traces depict raw data from one squirrel before, during and after 10 min periods of artificial manipulations of Th below (black bars) and above (hatched bars) normal values. Different scales for normoxic and hypoxic values are shown to demonstrate the influence of Th manipulation under both oxygen conditions.

