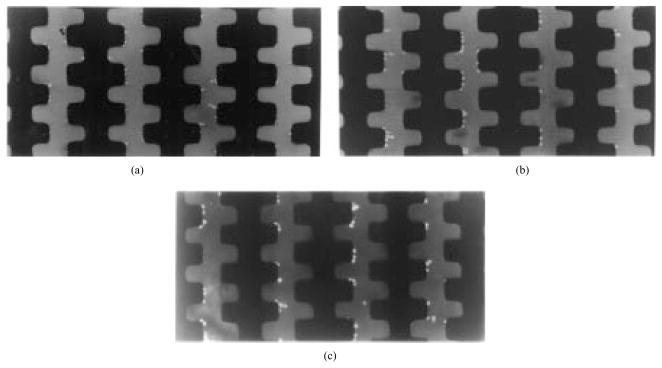
Fig. 2.
Sequence of cell separation by dielectric affinity chambers. (a) After DEP collection at 500 kHz, all cells were accumulated at electrode edges before the fluid flow was started. (b) The DEP frequency was dropped to 50 kHz and fluid flow started at 10 μL/min. Blood cells were released and carried off by the eluate (these cells appear as streaks between the electrodes), while human breast cancer cells were retained. (c) Cancer cells remained on the electrode tips after blood cells had been swept downstream.

