Fig. 3.
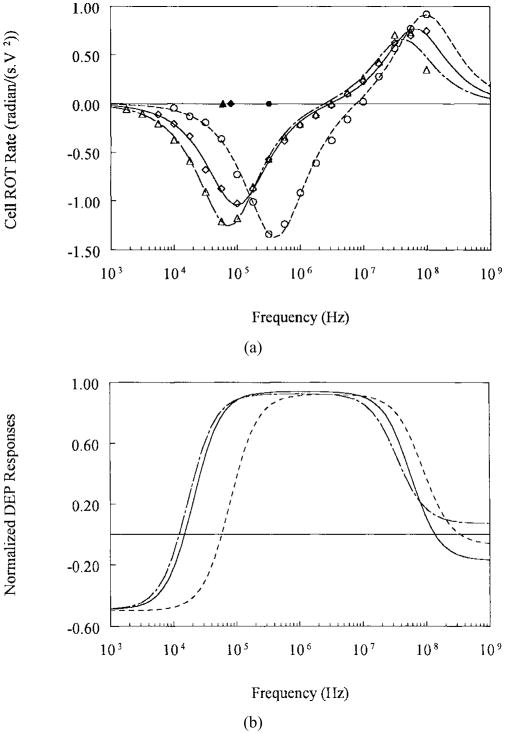
(a) Typical ROT spectra for the human breast cancer cell lines MDA-231 (◇), MDA-468 (△) and for T-lymphocytes (o) in isotonic sucrose suspension of conductivity 56 mS/m. Continuous curves are the best fits of single-shell dielectric model [8], [15], [25]. (b) DEP responses for the same cell types calculated from the dielectric parameters derived from the ROT spectra for the conditions used in cell separation experiments MDA-231 cells (—), MDA-468 (— –), and for T-lymphocytes (– – –).

