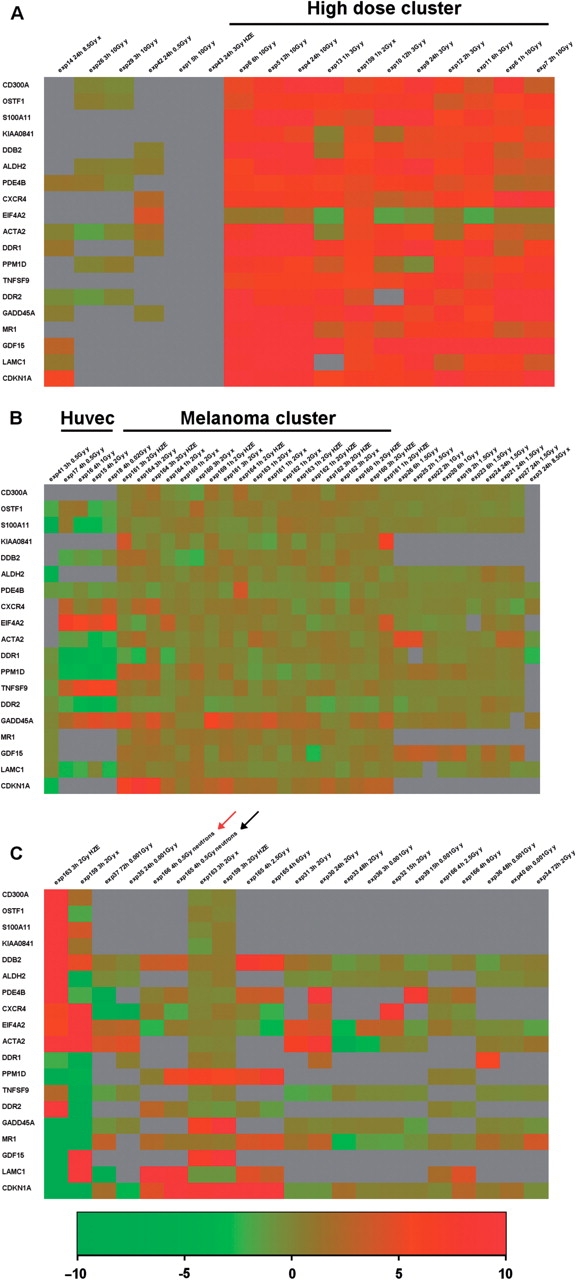
Figure 3.

Hierarchical clustering of data for 18 genes which pass the log2 ratio cut-off: >1 in at least 20% of the experiments. Gene tree and conditions tree clustering were performed by selecting the following parameters: Euclidean distance and complete linkage. The condition tree has been zoomed by using the online tools and horizontally separated in three areas: the left portion (A) the central part (B) and the right portion (C).
