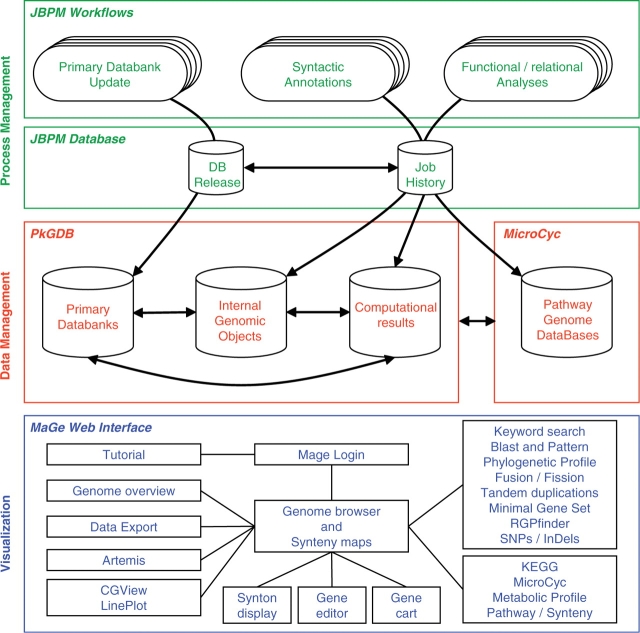
Figure 1.
The three components of the MicroScope platform. The MicroScope deployment diagram presents three software architecture components: (i) in green, the process management system based on jBPM framework which orchestrates all the analyses of the annotation pipeline, (ii) in red, the PkGDB and MicroCyc databases which respectively manage genomic and metabolic data, and (iii) in blue, the MaGe Web interface which is directly connected to the databases and allows users to browse and edit data.

