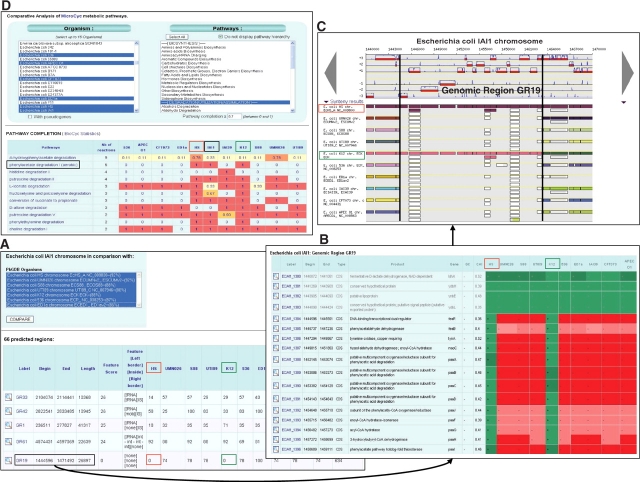
Figure 2.
Comparative genomic functionalities in MaGe. A query result of the RGPfinder tool is shown in (A). In this example, E. coli IAI1 is compared with 10 other E. coli strains. A total of 66 regions of genomic plasticity are predicted. These regions are summarized in a table that displays their chromosomal location, the presence of genomic island features, and a specificity score for each compared strains. A detailed view of the predicted regions is available as shown in (B) for the region GR19. This region contains a gene cluster (i.e. the paa-operon) coding for enzymes of the phenylacetate degradation pathway. As shown by the colour code (i.e. green for the presence of a homolog gene, red for the absence), only two others E. coli strains (K12 and HS) share this region with the IAI1 strain. The synteny break points between the E. coli core genome and this metabolic region can be visualized using the cartographic representation of the synteny results (C). On these maps, a rectangle represents a putative homolog in the compared genome and a group of rectangles of the same color indicates a conserved synteny. (D) Shows the ‘Metabolic Profile’ functionality. The metabolic networks of eleven E. coli strains are compared in respect to pathway completion. In this example, only MicroCyc degradation pathways are selected and the pathway completion threshold is set to 0.7. Results are summarized in a table which gives, for the 11 selected strains, completion values for each pathway. Results confirm that the phenylacetate degradation pathway is complete in only three E. coli strains (IAI1, K12 and HS).

