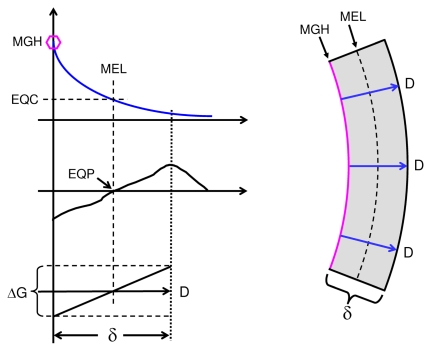
FIGURE 2.
Curvature formation by hermetic morphogen; single concentration gradient shown on top left, MGH (hexagon) indicates morphogen gradient head; left middle graph illustrates a theoretical hormetic response curve of field cells to the morphogen gradient (compare Figure 1); bottom left graph illustrates a linearized part of the induced growth gradient (ΔG) along the morphogen gradient. Right panel: concave curvature of mural section by radial gradients of the hormetic morphogen (blue arrows) that induce declining inhibition of mural cell growth from morphogen gradient heads up to the morphogen equidyne line (MEL), beyond which mural cell growth is gradually stimulated. EQC: Morphogen equidyne concentration; EQP: equidyne point of field cell hormesis curve. At a mural thickness (δ) of 0.5 mm and a 20% morphogen gradient-induced growth difference (compare Figure 1), the resulting curvature of the wall would result in a theoretical vessel internal diameter of 5 mm.

