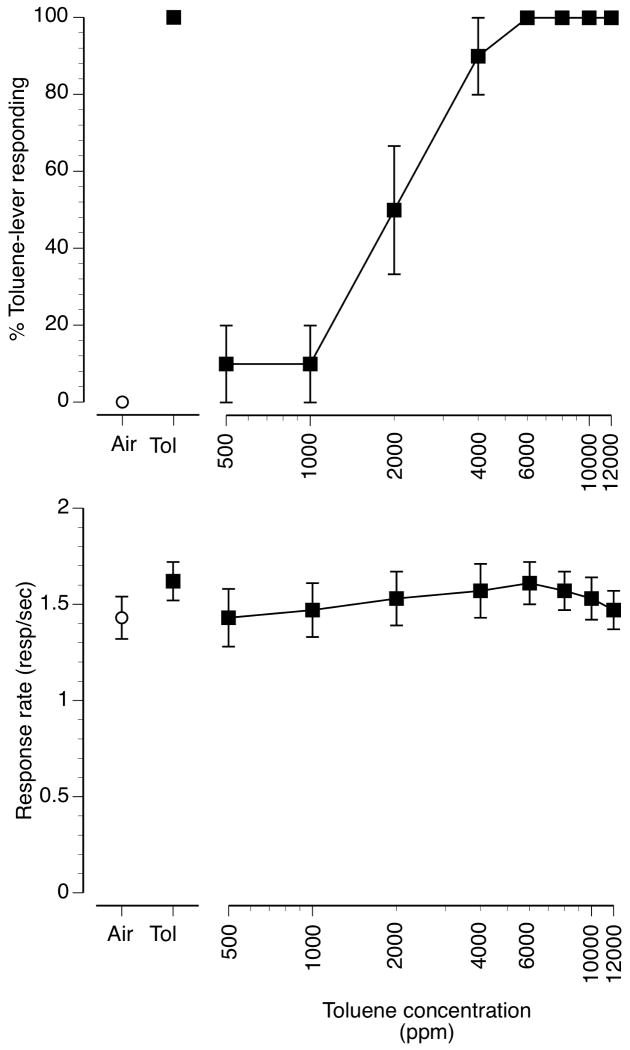
Figure 1.
Concentration-effect curve for inhaled toluene vapor in mice (n=10) trained to discriminate 10 min of exposure to 6000 ppm inhaled toluene from air. Points above Air and Tol represent the results of air (open circle) and 6000 ppm inhaled toluene (filled square) exposure control sessions. Mean (± SEM) percentages toluene-lever responding are shown in the upper panel, Mean (± SEM) response rates in responses/sec are shown in the bottom panel.

