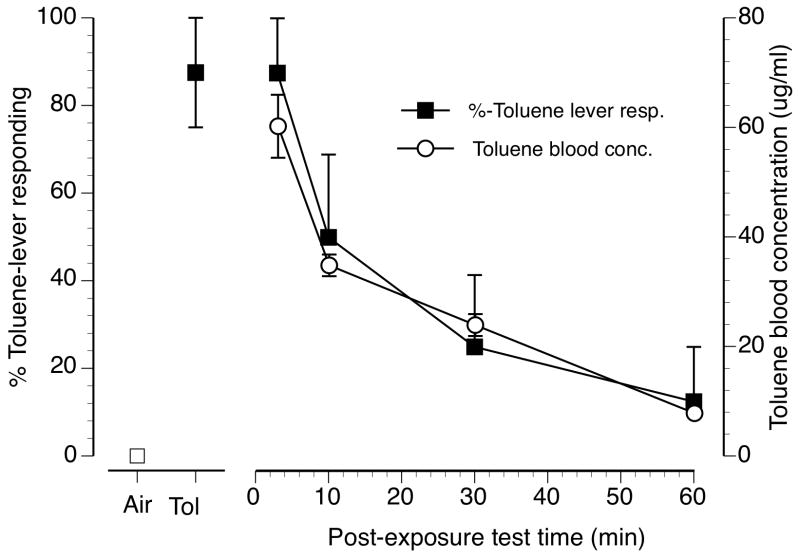
Figure 2.
Discriminative stimulus and toluene blood concentration time course following 10 min of exposure to 6000 ppm toluene vapor (n=8). Filled squares represent mean (± SEM) toluene-lever selection. Open circles represent mean (± SEM) toluene blood concentrations in ug/ml. Points above Air and Tol represent toluene lever selection on air (open square) and 6000 ppm inhaled toluene (filled square) exposure control sessions.

