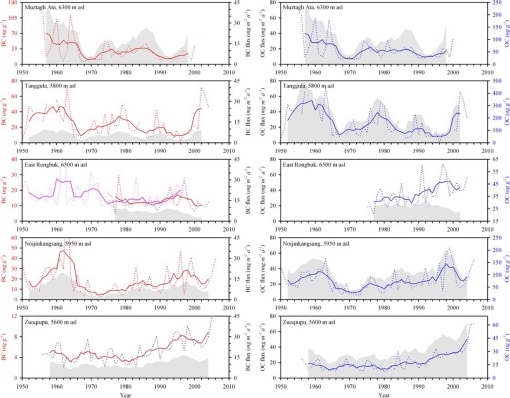
Fig. 2.
BC and OC in the five ice cores. Dotted line is annual concentration (ng g−1), solid line is 5-year running mean, and gray shaded region is the integrated annual deposition. Results of Ming et al. (23) for the East Rongbuk glacier on Mount Everest are shown for comparison.

