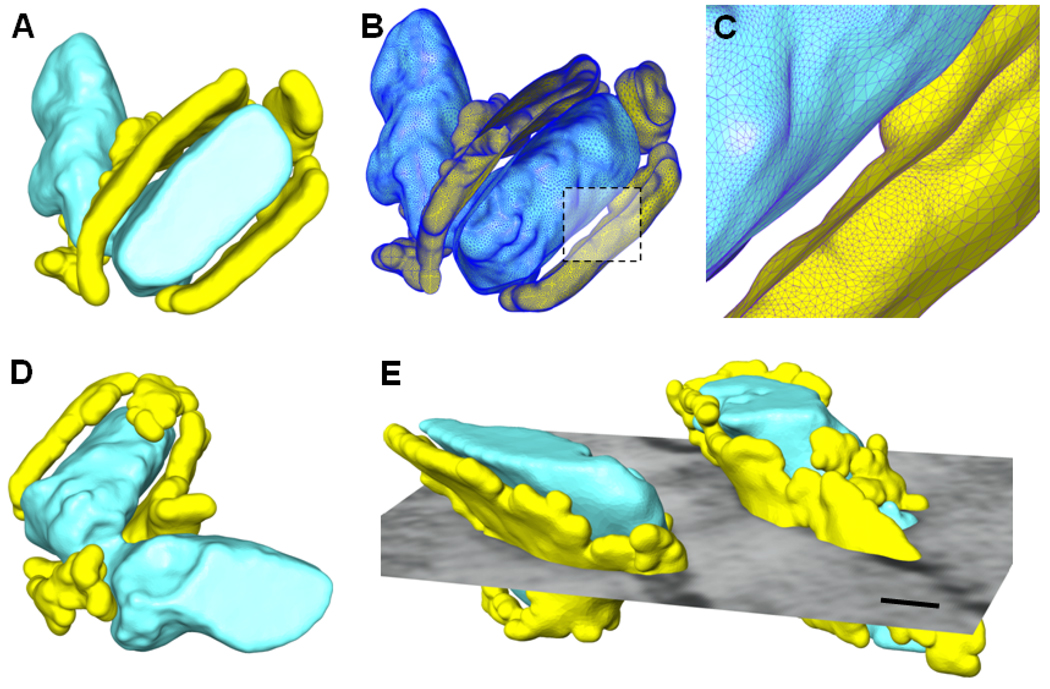
Figure 3.
More examples of geometric modeling from EM imaging data. (A) The surfaces rendering of the extracted T-tubules (the thick structures in cyan) surrounded by jSR (the thin structures in yellow). (B) The surface mesh representation with the front part cut out. (C) A close view of the dyadic cleft as indicated by the dashed rectangle in (C). (D) Another view of the same model as shown in (A). (E) Another example of geometric modeling of T-tubules (the thick structures in cyan) and the surrounding jSR (the thin structures in yellow). A cross section of the original image is shown together with the models. Scale bar in (E): 50 nm.

