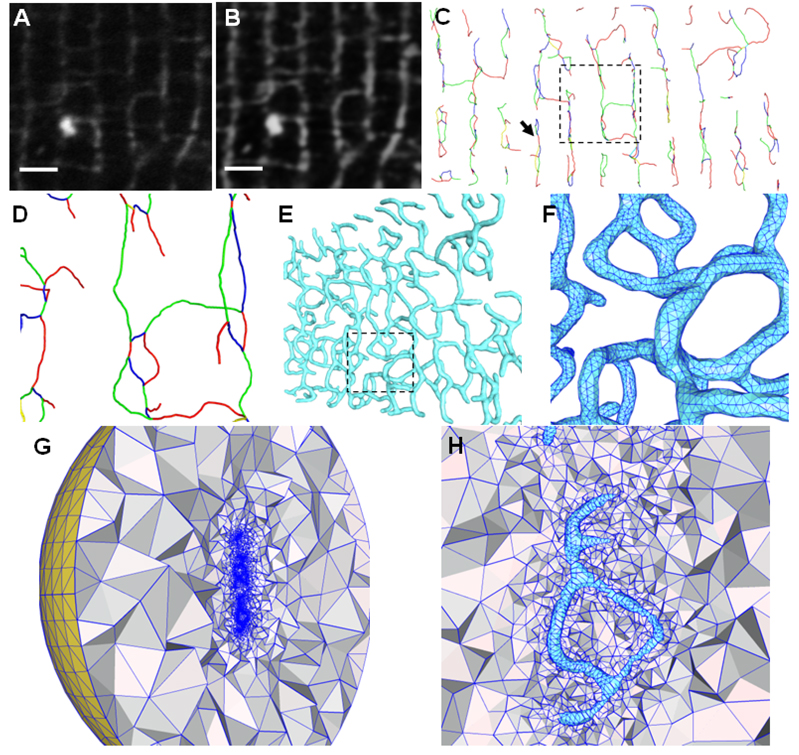
Figure 4.
Illustrations of image pre-processing and geometric modeling of T-tubules from light microscopic images. (A) The original T-PM image (a small portion of the cross-section). (B) The image after contrast enhancement and noise reduction. (C) The skeletons extracted directly from the 3D LM images. All adjacent branches have been colored differently to distinguish between them, although the color scheme used does not convey any biological information. A close view of the rectangular region is shown in (D) with a small amount of rotation to the left to demonstrate the 3D network in the depth direction. (E) The surface triangulation is constructed based on the skeletons using the pseudo-molecule approach. The model is rotated to the left by about 45°. The rectangular region, with triangulation details, is enlarged in (F). (G) and (H) show the tetrahedral mesh bounded by the surface triangulation of (E). A large artificial bounding sphere (yellow in (G)) will serve as the domain boundary to solve simulation problems. Note that the T-tubular structures (in cyan) near the center in (H) are empty and the tetrahedral meshes exist only between T-tubules and the bounding sphere. The region in (H) roughly corresponds to that indicated by the arrow in (C). Scale bars in (A,B): 2 µm.

