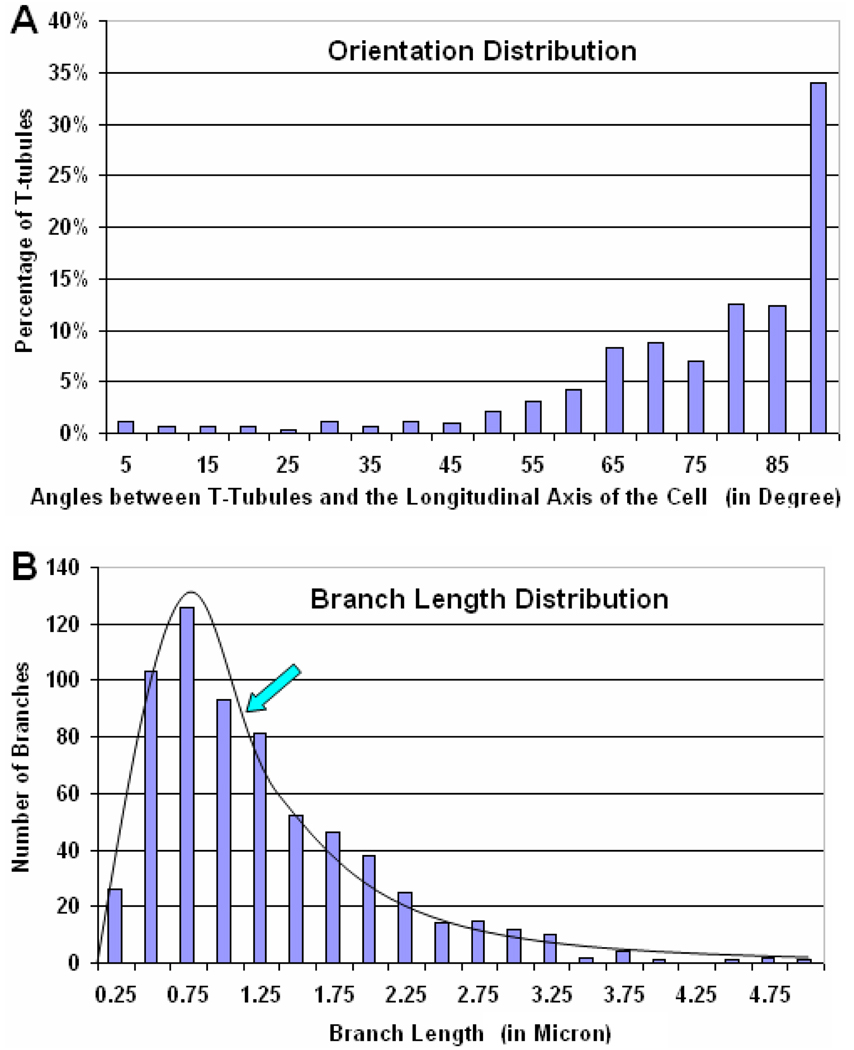
Figure 5.
Quantitative analysis of T-tubular systems using T-PM images. (A) The distribution of the orientation of T-tubules, which was calculated as the angle between each short line segment on the skeletons and the long axis of the cell. Most T-tubules have orientations roughly perpendicular to the longitudinal axis of the cell, implying that a majority of T-tubules lie on or near the Z-disks of ventricular myocytes. However, T-tubules can be in arbitrary orientation, forming a complicated three-dimensional network. (B) The distribution of T-tubular branch lengths. There is a sharp increase from 0.25 µm to 0.75 µm, which then decreases rapidly to ~5.0 µm. The average branch length of T-tubules in cardiomyocytes is about 1.15 µm, as indicated by the arrow. The median length is about 1.06 µm. The estimation of branch lengths indicates how densely the T-tubules are connected to each other.

