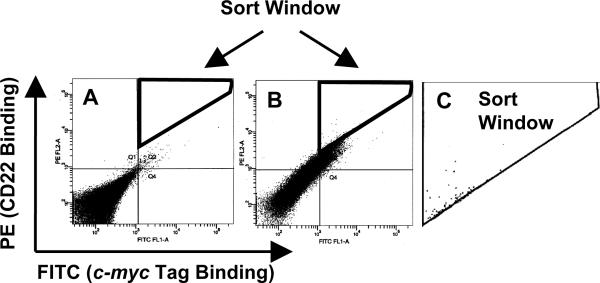
Fig. 3.
Enrichment of mammalian cells displaying an improved scFv variant by kinetic selection and flow cytometric sorting. The dot plot shows only 50,000 cells of the total cell population (107). Each dot represents an individual observed cell. The cells were labeled with no antigen (A) or 1nM antigen (CD22-Fc) (B) concentration for separation. FITC fluorescence (binding to the c-myc tag) represents the number of surface expressions on an individual cell. The PE fluorescence represents binding to the antigen (CD22). A sort window (C) was drawn to include the top 0.1% of total cells in terms of ratio of PE:FITC fluorescence. Cells that fell within the window were collected. (Originally published in Proceedings of the National Academy of Sciences 103(25):9637-9642, June 20, 2006); copyright 2006 National Academy of Sciences, U.S.A.)

