
Fig. 5.
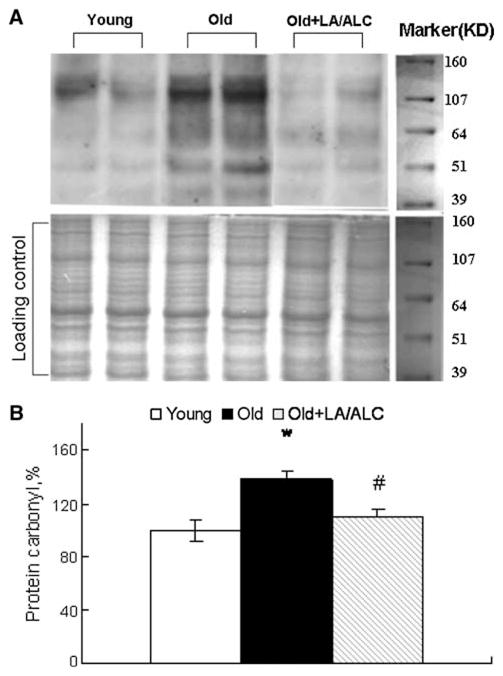
Protein carbonyls in the mitochondria of rat brain. Values were normalized by loading control, setting the protein carbonyls in Young rats as 100%. a Representative blotting of Protein carbonyl and duplicate Gel dyed with Coomassie brilliant blue as loading control, b Quantitative results. Values are mean ± SEM from 7 rats in the group of the Young or the Old, and 6 rats in the group of the Old fed with Old + LA/ALC. *P < 0.05 vs. Young, and #P < 0.05 vs. Old