
Fig. 6.
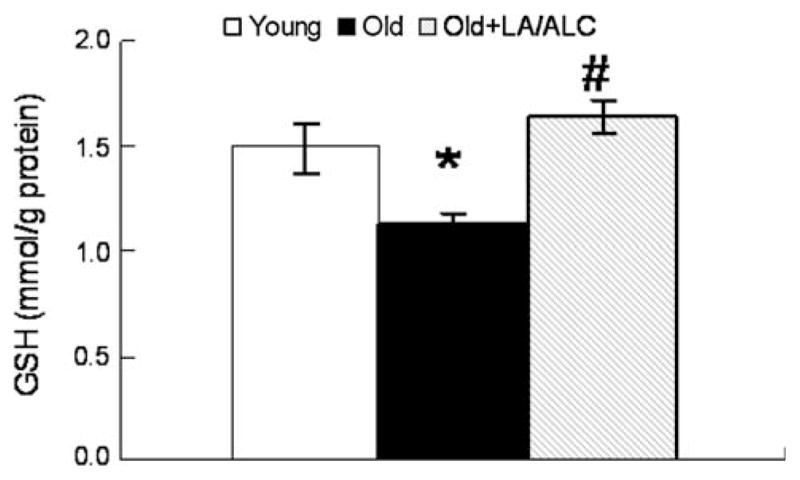
GSH level in the mitochondria of rat brain. Values are mean ± SEM from 7 rats in the group of the Young or the Old, and 6 rats in the group of the Old fed with Old + LA/ALC. *P < 0.05 vs. young, and #P < 0.05 vs. Old
Official websites use .gov
A
.gov website belongs to an official
government organization in the United States.
Secure .gov websites use HTTPS
A lock (
) or https:// means you've safely
connected to the .gov website. Share sensitive
information only on official, secure websites.
GSH level in the mitochondria of rat brain. Values are mean ± SEM from 7 rats in the group of the Young or the Old, and 6 rats in the group of the Old fed with Old + LA/ALC. *P < 0.05 vs. young, and #P < 0.05 vs. Old