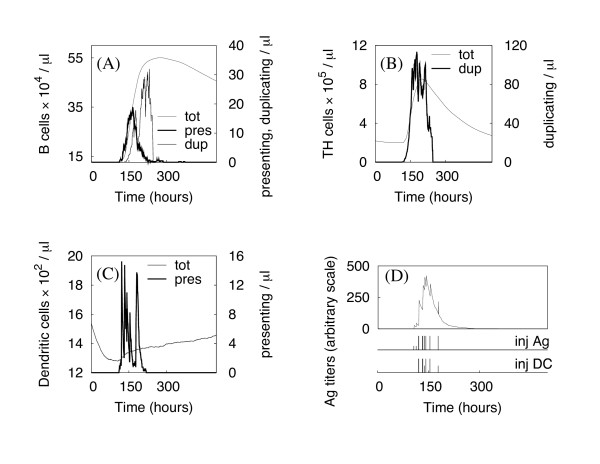
Figure 5.
Simulation of an immune response during an infection. The different panels show the dynamics of B cells, TH cells, and DCs (panels A, B, C, respectively), in the different states. Tot stands for total cell number, pres are the cells currently presenting the antigen at their surface, whereas the dup cells are the duplicating ones. Panel D shows the Ag concentration inside the lymph node, identifying the time window of infection. Vertical lines show the times of Ag and DC injection (inj Ag and inj DC, respectively).

