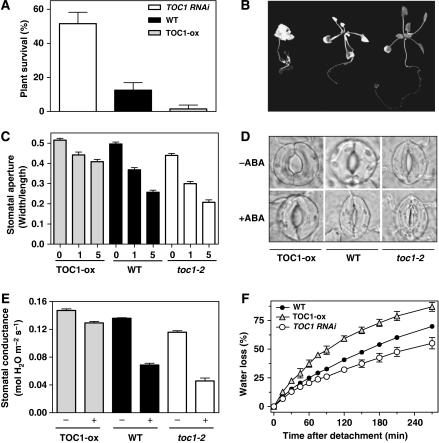
Figure 2.
Altered responses to drought conditions of plants mis-expressing TOC1. (A) Plant survival to dehydration stress on agar plates. Data are means±s.e.m. of duplicate experiments with at least 25 plants per genotype. (B) Representative photographs of TOC1-ox (left), WT (middle) and TOC1 RNAi (right) plants of the dehydration experiments. (C) Stomatal aperture in rosette epidermis of TOC1-ox, WT and toc1-2 plants. Stomatal dimensions were measured after incubation for 2 h in a buffer containing 0, 1 or 5 μM ABA. Data are means±s.e.m. of duplicate experiments with at least 100 stomata per genotype and per treatment. (D) Representative images by light microscopy of the stomata guard cells. (E) Stomatal conductance of TOC1-ox, WT and toc1-2 mutant plants. Gas exchange measurements were performed with at least 10 rosettes for genotype. (F) Water-loss rates of detached rosettes from WT, TOC1-ox and toc1-2 plants. Data are means±s.e.m. of triplicate measurements with at least five rosettes for genotype at each time point. Compared with WT, the phenotypic differences were statistically significant with P-values below 0.01 in all cases.

