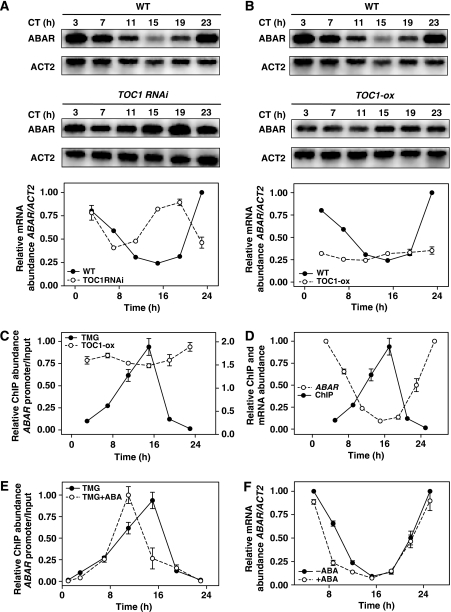
Figure 4.
TOC1 binds to the ABAR promoter and regulates ABAR circadian expression. (A, B) Northern blot analysis of TOC1 RNAi and TOC1-ox plants synchronized under LD cycles followed by 2 days under LL. The waveforms of ABAR expression after mRNA quantification are shown below the blots. CT, circadian time. (C) ChIP assays with TOC1-ox (right axis) and TMG plants (left axis) after TOC1 immuno-precipitation with an antibody to YFP followed by Q-PCR amplification of the ABAR promoter. (D) Comparison of the antiphasic waveforms of ABAR expression by northern blot and TOC1 binding to the ABAR promoter by ChIP assays. (E) Effects of ABA on the waveform of TOC1 binding to the ABAR promoter. (F) Effects of ABA on the ABAR mRNA expression. ChIP abundance was plotted relative to the maximum value.

