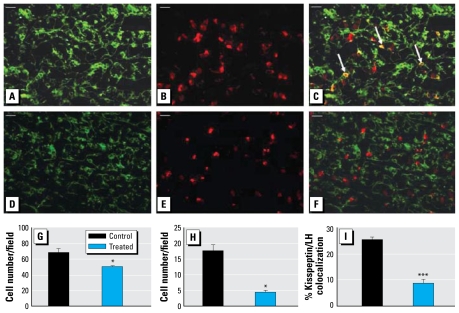
Figure 3.
Representative photomicrographs of staining for kisspeptin (A, D) and LHβ (B, E), and merged images (C, F), in fetal pituitaries from control (top) and treated (bottom) animals. Cells showing colocalization are stained yellow (indicated by arrows). Bar = 20 μm. (G–I) Quantification per field of view of the mean LHβ-immunopositive cell number (G), the mean number of cells immunopositive for both LHβ and kisspeptin cells (H), and percentage of kisspeptin/LHβ immunopositive cells as a proportion of the total number of LHβ-immunopositive cells (I) in fetal pituitary tissue sections from control and treated animals.
*p < 0.05, and ***p < 0.001, compared with respective control value.

