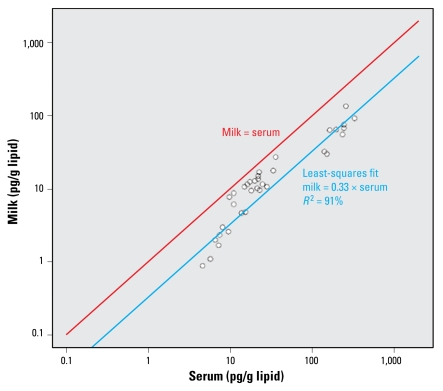
Figure 3.
Relationship between lipid-adjusted milk:serum concentrations (pg/g lipid) for three PCDDs (1,2,3,6,7,8-HxCDD, 1,2,3,4,6,7,8-HpCDD, OCDD) and 1,2,3,4,6,7,8-HpCDF. The red line shows the relationship “serum concentration = milk concentration.” The blue line is the least-squares fit for the data in this study.

