
Fig. 1.
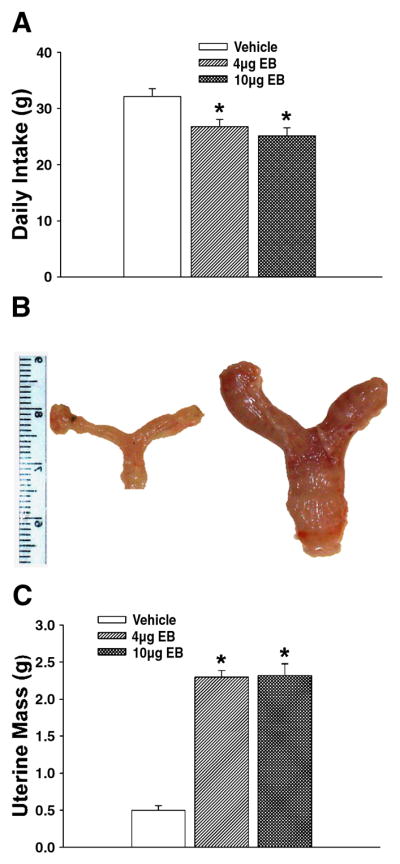
EB decreases food intake concomitantly with uterine hypertrophy. A, Composite bar graph showing the EB-induced decrease in cumulative food intake over 24 h. B, Composite photomicrograph of uteri and oviducts harvested from ovariectomized, vehicle- (left) and EB-treated (right) female guinea pigs. C, Composite bar graph illustrating the EB-induced hypertrophy of the female reproductive tract. Bars represent means and lines 1 S.E.M. of the daily intake and uterine masses under vehicle- and steroid-treated conditions. *, Values from EB-treated animals that are significantly different (one-way ANOVA/LSD; P<.05) than those from vehicle-treated controls.