Fig. 6.
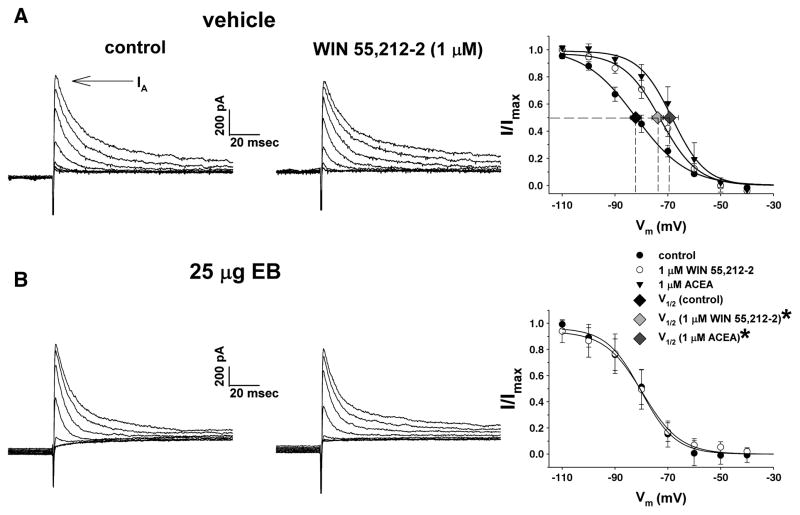
EB antagonized the CB1 receptor-mediated shift in the voltage dependence of the IA. This figure depicts the IA evoked in arcuate neurons from vehicle-treated (A) and EB-treated (B) slices during the inactivation protocol. The IA is observed as a transient outward current immediately following delivery of the test pulse (denoted by the arrow). On the left is the IA observed under baseline control conditions. In the middle is the IA evoked in the presence of WIN 55,212-2 (1 μM). On the right are the composite inactivation curves for the IA. The Boltzmann equation fits the curves to the corresponding data points. Symbols and accompanying vertical lines represent means ± 2 S.E.M. of peak currents normalized to the Imax that were observed at the test pulse following a given pre-pulse. Symbols and accompanying horizontal lines represent means ± 2 S.E.M. of the V½ derived from the inactivation curves prior to (vehicle: n=18; EB: n=6), and in the presence of, WIN 55,212-2 (vehicle: n=13; EB: n=6) or ACEA (1 μM; n=5). *, The estimated V½ derived from arcuate neurons in the presence of WIN 55,212-2 and ACEA that is significantly different (P<.05; one-way ANOVA/LSD) than that observed under baseline control conditions.

