
Figure 3.
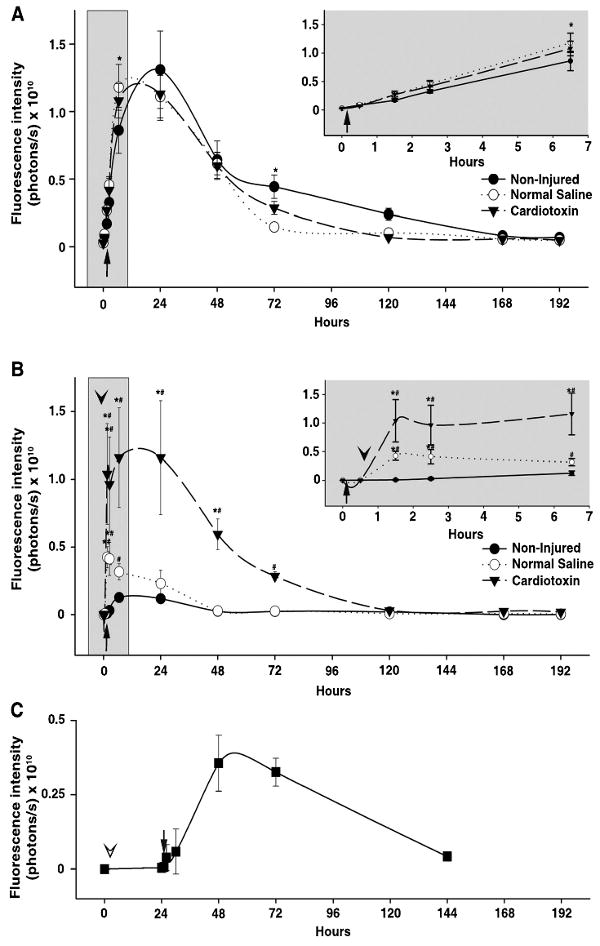
Kinetics of IR-820 in normal and injured lower limb muscle tissue of HairlessSKH1/SKH1 mice. (A) The signal intensity plot of non-injected, left hind limbs. Inset graph demonstrates an expanded view of the early time points immediately following IR-820 injection. * denotes p≤0.03 in pairwise comparison between normal saline or cardiotoxin groups compared to the Non-injured group. Error bars, s.d.; n=3-4 mice/group. (B) Paired difference of injected hind limb and non-injected hind limb, time on x-axis measured after IR-820 injection (arrow); cardiotoxin or normal saline injection into the right hind limb denoted by the arrowhead. Inset graph demonstrates an expanded view of the early time points immediately following IR-820 and cardiotoxin or normal saline injection. * denotes p≤0.01 in pairwise comparison between groups. # denotes p≤0.03 for each time point within each group compared to baseline, defined as 0.5 hours after IR-820 injection and prior to cardiotoxin or normal saline injection. Error bars, s.d.; n=3-4 mice/group. (C) Ongoing vascular leak demonstrated by the paired difference of cardiotoxin (right) and normal saline (left) injected hind limbs (arrowhead) followed by intraperitoneal IR-820 injection (arrow) 24 hours later. Time on x-axis measured after cardiotoxin and normal saline injections. Error bars, s.d.; n=2 mice/group.