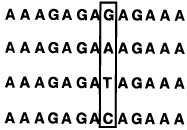
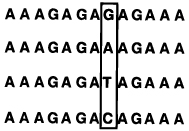
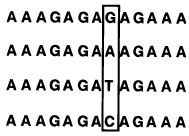
Table 3.
Selectivities of Linear, Circular, and Bicyclic Oligonucleotides, As Measured by Free Energy Differences (ΔΔG°37) between Binding Correct and Singly-Mismatched Targets as Shown (See Ref 95)a,b
| pH=7.0 | selectivity | |||
|---|---|---|---|---|
| ligand | targets | |||
| Tm(°C) | −ΔG°37 (kcal/mol) | ΔΔG°37 (kcal/mol) | ||
|
T T T C T C T C T C T T T (Watson–Crick complement) | ||||
 |
45.1 | 10.7 | -- | |
| 25.0 | 5.5 | 5.2 | ||
| 27.4 | 5.8 | 4.9 | ||
| 23.7 | 5.1 | 5.6 | ||
 | ||||
 |
54.7 | 17.5 | -- | |
| 35.8 | 8.3 | 9.2 | ||
| 36.3 | 8.5 | 9.0 | ||
| 37.3 | 8.9 | 8.6 | ||
 | ||||
 |
64.3 | 25.2 | -- | |
| 49.1 | 13.4 | 11.8 | ||
| 48.2 | 14.4 | 10.8 | ||
| 49.1 | 15.2 | 10.0 | ||
Conditions: 1.5 µM concentration each strand, 100 mM NaCl, 10 mM MgCl2, 10 mM Na•PIPES buffer.
Error limits for individual measurements are estimated at ±0.5 °C in Tm and ±5–10% in free energy.
