
Figure 1.
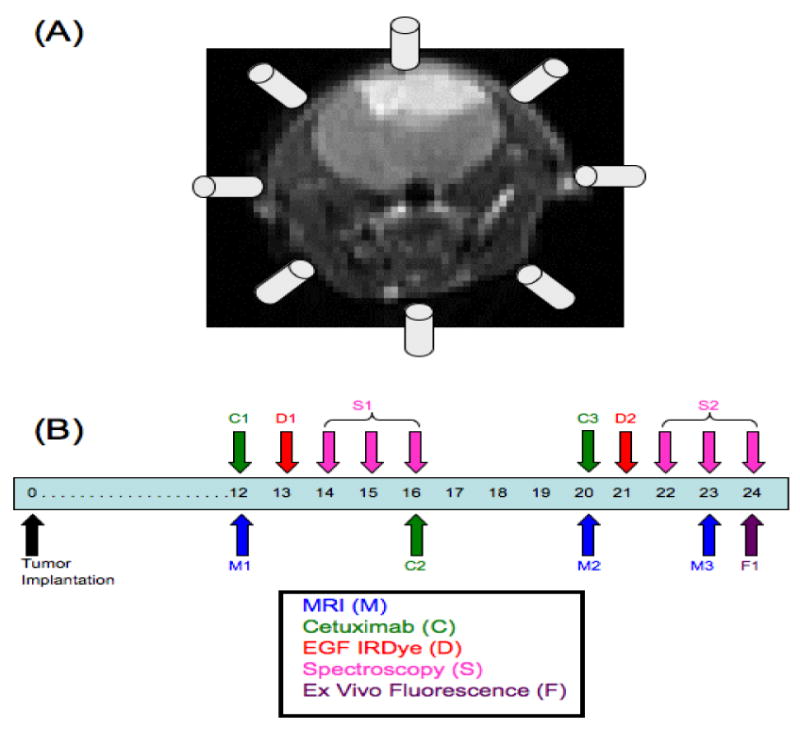
(A) Eight of the sixteen available channels from the multichannel transmission spectroscopy system were used to encircle the head of the mouse in a coronal plane during measurement collection. The in vivo experimental timeline is shown in (B) where the experiment began with tumor implantation on day 0. Each mouse in the study received MRI (M), EGF-IRDye (D) and fluorescence spectroscopy monitoring (S) on the days shown. Only mice in the treated groups received cetuximab therapy (C) on the days shown.