
Figure 5.
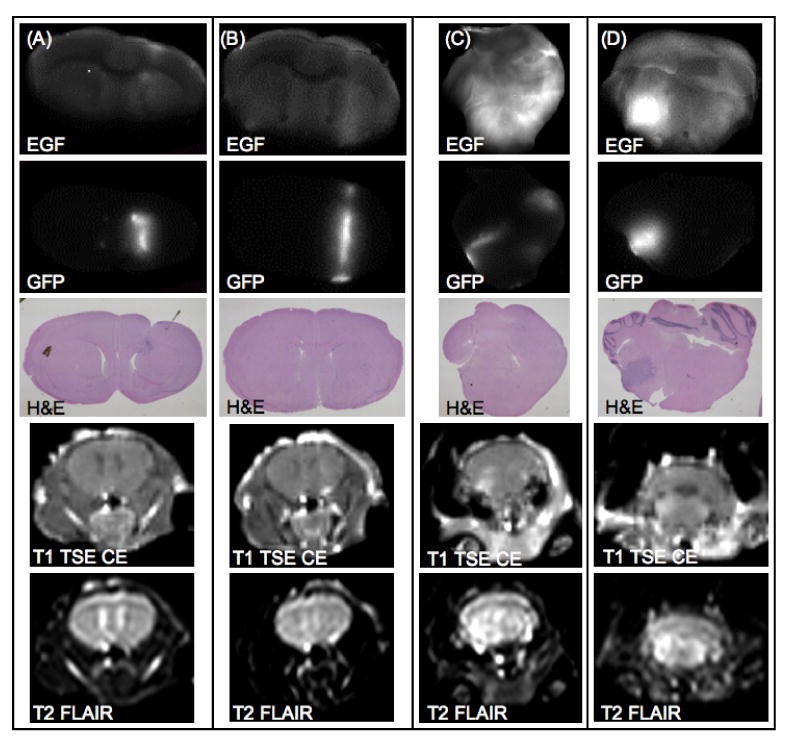
Ex vivo coronal images of representative examples from the U251-GFP tumor-bearing group are shown. Two example mice from the U251-GFP cetuximab treated group are shown in (A) and (B). Two example mice from the U251-GFP untreated group are shown in (C) and (D). EGF-IRDye fluorescence (row 1) was compared with GFP fluorescence (row 2) and H&E images (row 3) and demonstrated decreased fluorescence in the treated group as compared to the untreated group. Representative examples of in vivo MRI images showed that the U251-GFP tumors were difficult to detect using T1 TSE CE MRI (row 4) or T2 FLAIR MRI (row 5).