
Figure 6.
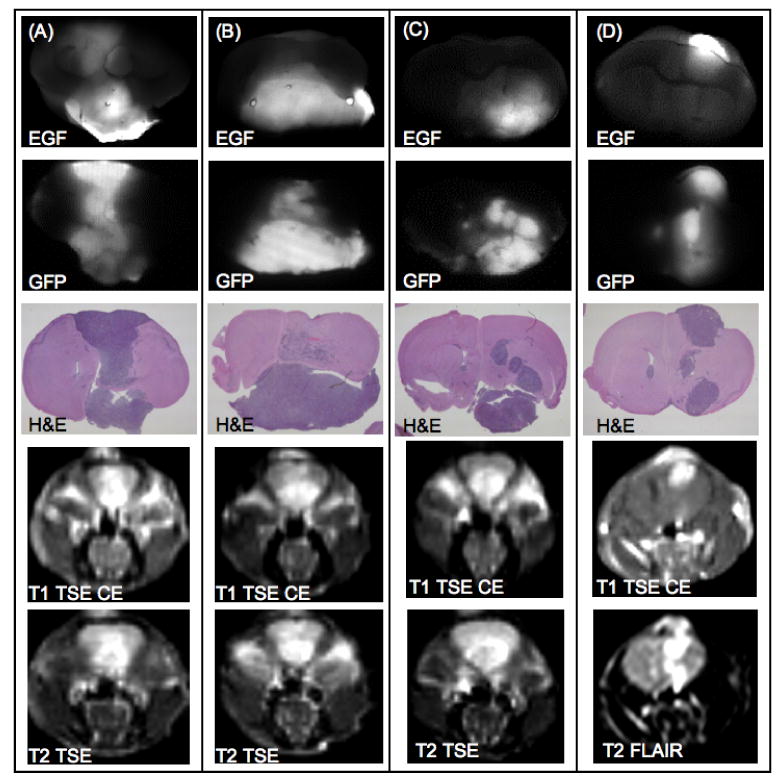
Ex vivo coronal images of representative examples from the 9L-GFP tumor-bearing group are shown. Two example mice from the 9L-GFP cetuximab treated group are shown in (A) and (B). Two example mice from the 9L-GFP untreated group are shown in (C) and (D). EGF-IRDye fluorescence (row 1) was compared with GFP fluorescence (row 2) and H&E images (row 3) and demonstrated heterogenous fluorescence within the tumor tissue that was similar for the treated and untreated tumors. Representative examples of in vivo MRI images showed visible tumor masses by T1 TSE CE MRI (row 4) or T2 TSE and T2 FLAIR MRI (row 5).