
Figure 3.
Custom 44K Oligo-Array-CGH Plots for Analysis of the Copy Numbers within the Region 152.70 Mb to 153.65 Mb at Xq28
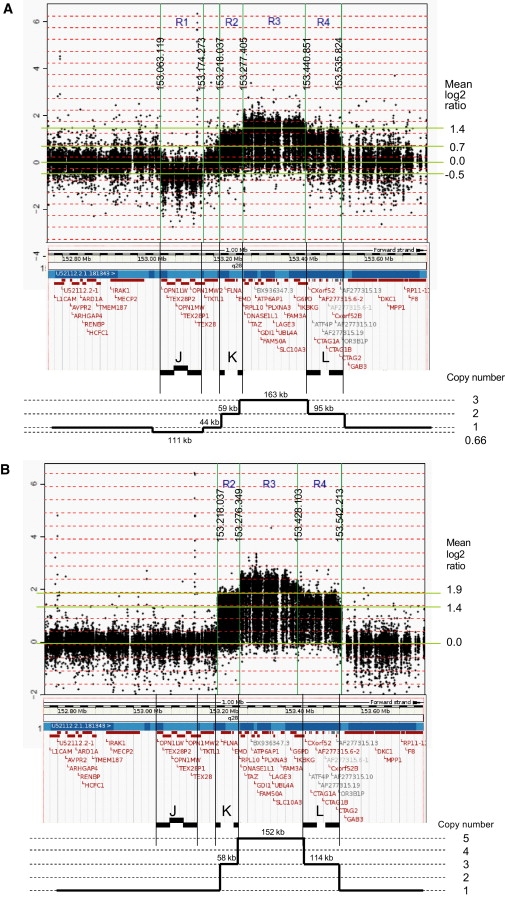
(A) Patient IV.2 of family 1.
(B) Patient II.1 of family 2.
The borders of the copy-number-variable regions (R1 to R4) are indicated by vertical lines with the positions of the breakpoints shown. The mean log2 Cy5/Cy3 ratio (y axis) of each region is given at the right. Below each plot the Ensembl view of the corresponding region is shown with the LCR sets (J, K, L) indicated. At the bottom, we show a schematic representation of the copy number of each region, based on the array-CGH data.