
Figure 6.
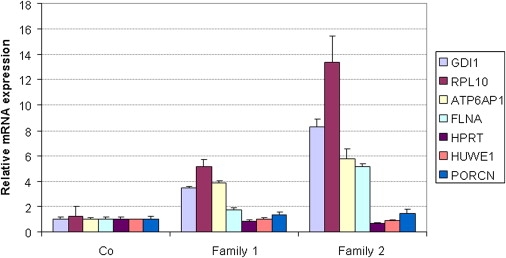
mRNA Expression Analysis of GDI1, RPL10, ATP6AP1, and FLNA in Affected Members of Families 1 and 2 with a Copy-Number Gain at Xq28
cDNA was prepared from RNA extracted from blood (controls, family 2) or EBV-PBL cell lines (controls, family 1). Compared to controls, all affected individuals showed significant increased mRNA levels for all four genes. Expression was determined by qPCR and normalized to the expression of HPRT. Expression levels are calculated relative to the mean levels obtained in the control samples (fold difference; y axis). Standard deviations of at least two independent experiments are indicated for each bar.